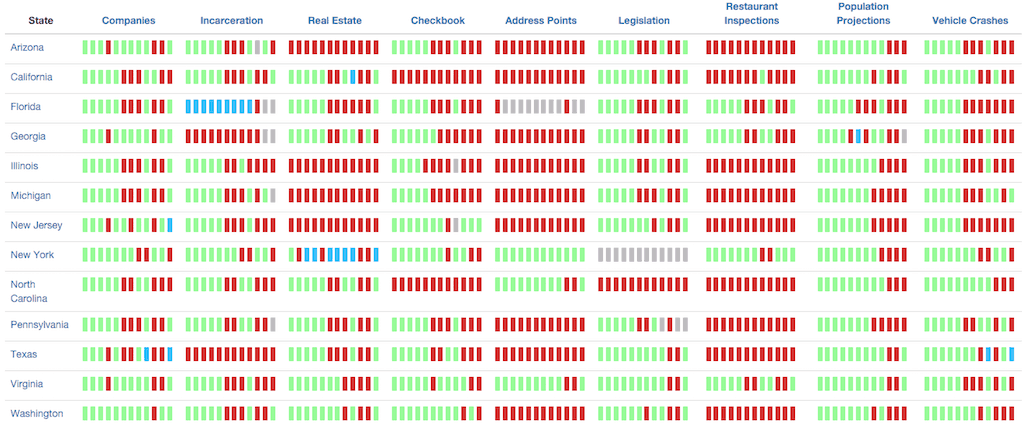
Today we’re taking the wraps off our long-in-development U.S. States Open Data Census, the first census of the open data holdings of U.S. states.

This census is notable for being the first data census of its kind, using interesting new software, and advancing some new best practices for publishing open data. We’re launching with comperehensive data for the 13 most populous U.S. states (covering over 60% of the population). This will allow for public review before we begin the push to survey the remaining 39 states and territories.
Why States
U.S. states are powerful, chronically undervalued holders of crucial datasets, including legislation, spending, incarceration, corporate registries, and more. State CTOs, CIOs, and CDOs find it difficult to measure their successes in publishing open data, and some have expressed enthusiastic support for a way to compare their work against other states, something that was previously impossible because there wasn’t a state data census. We want to promote standards for what data that states should publish and how they should publish it.
The Software
Difficulty deploying Open Knowledge’s popular Open Data Census software led to a search for alternatives. That’s when we discovered that Code for America’s Indianapolis brigade had built an Open Data Census clone in order to launch their great Police Open Data Census. (The Open Indy Brigade is doing signal work in the field of data about policing.) Their code was bespoke for police data, so we forked it and set about abstracting it to serve our purposes. The result isn’t something that’s ready to be deployed for general use, but it is an improved system, and we hope to work with the Indy Brigade to turn it into a general-use data census application.
The software uses Gulp, Bower, and Node.js to generate static files that can be deployed to GitHub Pages (or, really, any data host). The data lives in Google Sheets, and the software uses Tabletop.js to retrieve and display that data in the client.
We took the additional step of using CloudFlare to serve the site over HTTPS (albeit incomplete HTTPS, since GitHub Pages doesn’t support HTTPS for custom domain names).
How Datasets were Selected
The dataset selection process was done in collaboration with Emily Shaw, who was until recently the Deputy Policy Director at the Sunlight Foundation. Starting with the G8 National Action Plan’s definition of “High-Value Datasets,” we selected representative datasets for each category, making allowances for the diffences between datasets appropriate for a nation and those appropriate for a state. Where necessary and possible, we consulted with experts in the field to help us to select datasets.
The Scoring Criteria
Also in collaboration with the Sunlight Foundation, we came up with the criteria that we’d use to evaluate the openness of each dataset. We used Open Knowledge’s global data census scoring criteria, and added three additional criteria of our own:
- Is there a mechanism by which somebody with a copy of a dataset can ensure that it was not altered in transit? e.g., is the data served over HTTPS, is an MD5 hash provided, or does the state provide a validation service, like Data Seal?
- Is the dataset available in the state’s data repository? (See “Incomplete Repositories Considered Harmful.”)
- Is the dataset complete?
The question of “completeness” requires considering both whether all of the data is there (does a list of state corporations include all of them?) and whether the data published is adequate to be useful (does a list of state corporations include their addresses?). For this we, again, consulted with experts in the field to help us define each dataset for the purpose of completeness. In particular, we’re grateful to the Sunlight Foundation’s Becca James, OpenAddresses’ Ian Dees, HDScores’ Matthew Eierman, and U.S. Deparment of Transportation CDO Daniel S. Morgan for their crucial help.
We decided to award 5 points for every criterion, with the exception of whether the data is machine-readable, for which we award 50 points, since that’s really the essence of open data. That yields a 100-point scale, which we use to calculate A–F grades.
The methodology is described in more detail on the census website.
Work Remaining
After pausing to process public feedback about the datasets and methodologies (which are welcome in the form of a GitHub Issue, tweets @opendata, or email), clearly the biggest work to be done is to survey the remaining 39 states and territories. Also:
- Simplify the site home page—it’s confusing and too wide.
- Move data off of Google Sheets and into a GitHub-hosted CSV, so that people can file pull requests to improve the data.
- Include a few more datasets in the census. In particular, air, water, and waste permits and corporate grants, which were accidentally omitted thus far.
- Grade each state, instead of just grading each dataset. (We’ve held off on this until the community can review the grading criteria.)
What You Can Do
The most useful thing that you can do is let us know about state datasets that we don’t have listed now. So if you’re an expert in Nebraska’s published incarceration data, we’d love to receive a pull request telling us about it, and we’ll include it in the census. If you just want to provide us with a list of the URLs for each surveyed dataset in your state, that would be an enormous help. And, of course, we’ve got open issues on the project repository—help is welcomed!